
Data Integrity — Don't Forget the Arrows
James Ladyman, December 2021
Illustrations (unless otherwise stated): Old Data Bloke
Data flow diagrams have been a growing trend in the clinical trial environment, partly through encouragement by the regulatory authorities.
My QA colleague shared with me the below simplified diagram, first used some years ago to visualise the data life-cycle in a clinical trial.
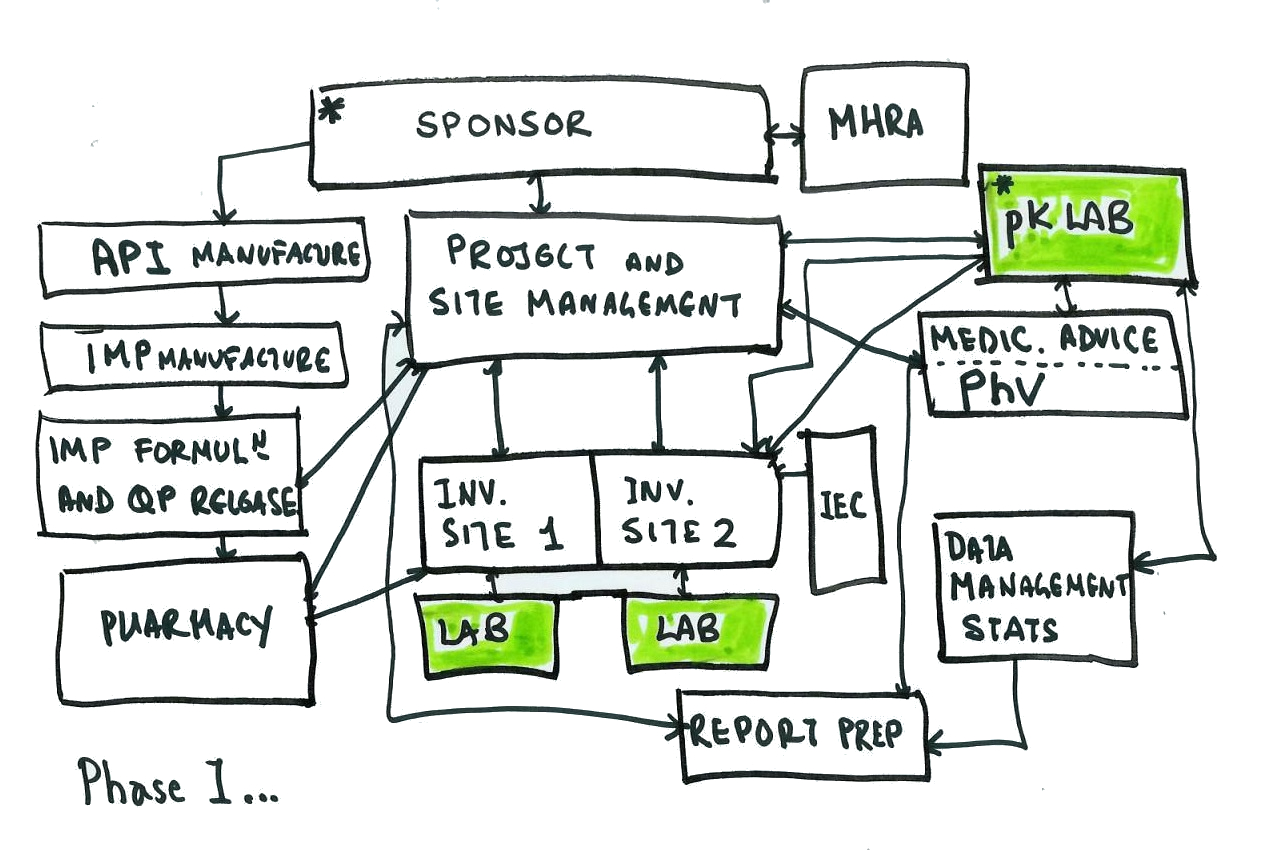
This diagram is somewhat simple and we can easily grasp where to focus our efforts and where data is flowing internally and externally.
Commonly, however, data flow diagrams look more like this:
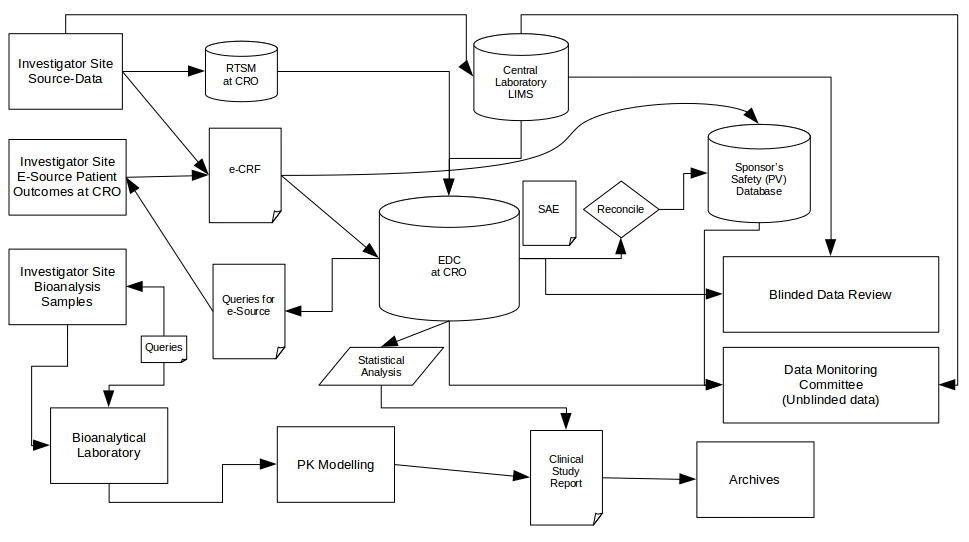
Certainly more visually busy but clearer than trying to describe the same situation only with words. We can also still see a few obvious systems where lots of critical efficacy and safety data is clustered which helps us focus our efforts on those systems (boxes).
Actually, it's all about the arrows
Until now the focus has often been on the areas represented by the boxes — systems or activities — when considering data integrity. However one thing that’s often lost in this process is the data flow itself: in other words the arrows. Recall our ‘bottleneck’ system: what should make this stand out to us is the arrows into and out-of the system not the system itself. Each of these arrows is itself a data transfer or process and whenever data is transferred there’s a risk to both its integrity and its confidentiality. Indeed recent data integrity guidance / regulations stress the importance of data integrity / encryption in transit and at rest — but the issues are far more than just encryption. (See the References below.)
So, why care about the arrows?
Arrows that cross organisational boundaries require special attention
That arrows indicate data transfer is nothing new, of course, and many of us will be familiar with EDT for example, when moving data between two systems as in: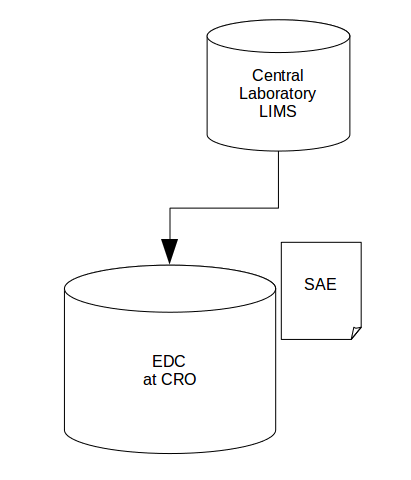
As a second example take this area of our second data flow:
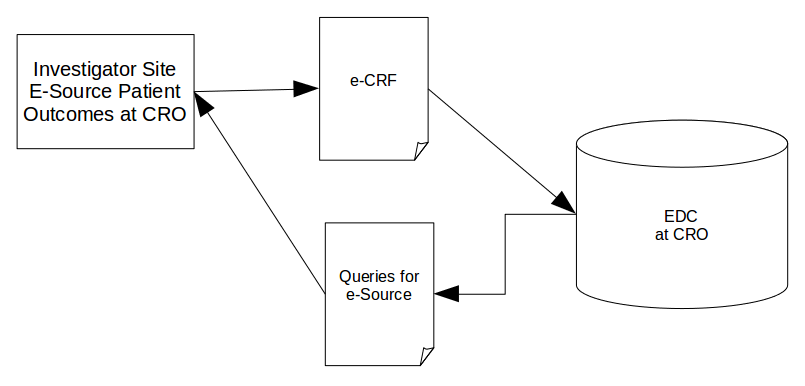
Whenever data is transferred between two organisations, even if it is only a ‘simple’ data transfer, there is always extra risk — don't forget, queries are important data in their own right.
What’s in an arrow? When data transfer becomes data transformation.
As we've already seen, not all arrows are created equal. For another example take the simple EDT figure we saw above:
This is a well understood process both in the IT world and in the clinical world and granted proper SOPs and training, should be somewhat painless. But take this:
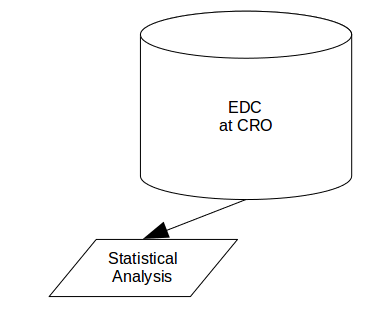
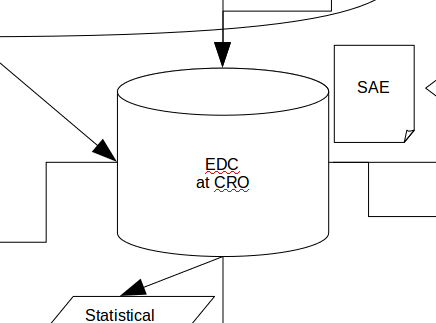
Here we won’t simply be sending raw data to the statistician (not twice anyway!) and is as much a transformation as a transfer. Another good example is this system and its associated arrows:
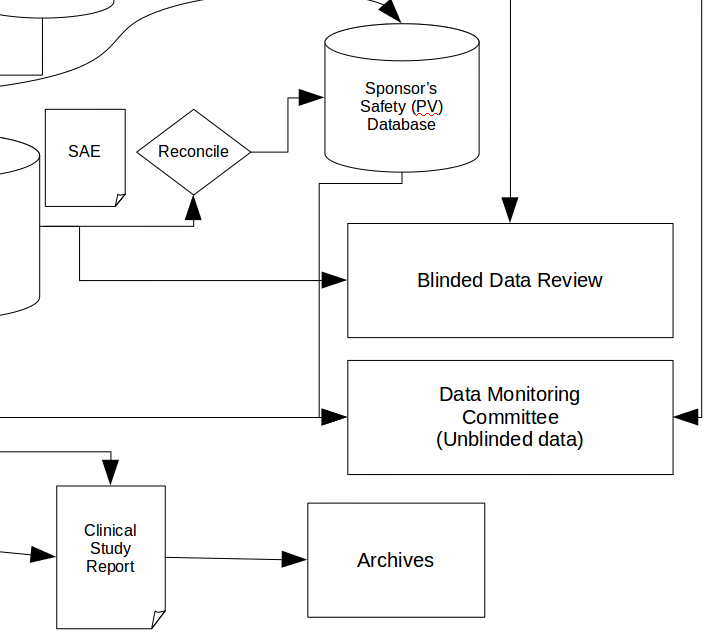
Note the arrow coming ‘in’ to this process. Sometimes this might be simple data transfer, at other times there are additional considerations, for example preserving the blind when transferring data for blinded data review, or ensuring only the correct subset of data is sent to the Data Monitoring Committee, which is data transformation as well.
A final concern issue: arrows that don’t go anywhere
Most worrying of all are arrows that don’t go anywhere, or which end in a ‘dead-end’ system — for example, in the last diagram above, neither the Blinded Data Review nor the Data Monitoring Committee meetings have any output. Look out for an upcoming article by JVB on this subject.
Conclusion
There is growing regulatory interest in all aspects of the data life-cycle and data integrity. Data-flow diagrams are a helpful tool in visualising the modern clinical trial and its many computer systems. Often, however, we focus on the boxes and not the arrows, assuming that they are ‘only’ simple data transfer but as we have seen this is not always the case and not all arrows are created equal.
References
- Title 21--Food and Drugs, Chapter I--Food and Drug Administration, Department of Health and Human Services, Subchapter A - General: Part 11 Electronic Records; Electronic Signatures
- Use of Electronic Records and Electronic Signatures in Clinical Investigations Under 21 CFR Part 11 – Questions and Answers
- Medicines & Healthcare products Regulatory Agency (MHRA), ‘GXP’ Data Integrity Guidance and Definitions 2018
- Data Integrity in Global Clinical Trials: Discussions From Joint US Food and Drug Administration and UK Medicines and Healthcare Products Regulatory Agency Good Clinical Practice Workshop
- Tackling Challenging Data Integrity Topics in 2020: Update on Good Clinical Practice Perspectives from the US FDA and MHRA UK